Research on impact performance fluctuation of high-strength petroleum casing
As the demand for oil increases and the mining geological environment becomes more severe, more stringent requirements are put forward for the high strength and toughness of steel used for oil casings. Especially now that the exploration of deep oil is intensified, oil casings must have stable Impact toughness. Low-alloy high-strength steel adopts micro-alloying technology and has a good strength-to-toughness ratio, which can reduce the quality of
octg casing, reduce material consumption, and increase economic benefits. Based on microalloying technology, supplemented by controlled rolling, controlled cooling and heat treatment processes, the properties of steel can be further improved, thereby refining the grains, obtaining ideal structures, and improving the toughness of steel. In addition, the impact toughness of steel is also related to the metallurgical quality. The causes of fluctuations in the impact toughness of high-strength and high-toughness petroleum casings are analyzed and studied in order to improve the impact toughness stability of steel types.

1. Test process and methods
Samples were taken from the company's newly developed φ368 mmx22.5 mm high-strength petroleum casing to detect its chemical composition. The results are shown inTable 1. The production process of high-strength petroleum casing of this specification is: 100 t electric furnace smelting → refining → continuous casting (medium 280mm billet diameter) → annular heating furnace heating → conical perforation + continuous rolling + fixed (reduction) diameter → quenching and tempering heat treatment (940 ℃ quenching + 645 ℃ tempering)->Physical and chemical property tests (tensile properties and 0 ℃ impact test). Among them, the tensile and impact samples were sampled from the middle part of the wall thickness of the 368 mmx22.5mm high-strength oil casing in accordance with the requirements of API Spec 5CT-2019 "Casing and Oil Pipe Specification". Physical and chemical property testing found that there are two types of samples with large differences in impact energy. Therefore, two types of samples with large differences in impact energy were analyzed separately in order to analyze the reasons for the large impact differences.
|
Table 1 Chemical composition (mass fraction) % of φ368mmx22.5mm high-strength petroleum casing test steel
|
|
Project
|
C
|
Si
|
Mn
|
P
|
S
|
Cr
|
Mo
|
AI
|
V
|
Nb
|
O
|
N
|
H
|
|
Actual value
|
0.15
|
0.25
|
1.46
|
0.013
|
0.004
|
0.15
|
0.26
|
0.03
|
0.05
|
0.025
|
0.0020
|
0.0070
|
0.0010
|
|
Standard value
|
0.12~0.16
|
0.2~0.5
|
1.3~1.5
|
≤0.030
|
≤0.030
|
0.1~0.3
|
0.2~0.3
|
≥0.02
|
0.03~0.07
|
0.02~0.03
|
-
|
-
|
-
|
After the performance test, the impact fracture surface was cleaned with acetone solution to determine the brittle area of the macroscopic fracture surface. The microscopic morphology of the fracture surface was observed with a scanning electron microscope, and energy spectrum analysis was performed on the inclusions. Inclusions are analyzed on the longitudinal section close to the impact sample, and on the 100x metallographic plane according to Method A in CB/T 10561-2005 "Standard Rating Chart Microscopic Examination Method for Determination of Non-Metallic Inclusion Content in Steel" To evaluate the level of inclusions, we combine SEM (Scanning Electron Microscope, scanning electron microscope) results and energy spectrum analysis to analyze inclusions of different shapes and chemical compositions. Inclusions are quantified by multiple layers of grinding. After counting the inclusions on the observation surface, the microhardness is detected, leaving a diamond-shaped indentation, and then polished to remove the depth of the diamond-shaped indentation of the microhardness. Repeat this 4 times, each time about 30 μm, with a total depth of approximately 90 μm, allowing for layered quantification of inclusions. The surface of the sample was etched with 4% nitric alcohol and saturated picric acid solution, and the grain size of the original austenite and the structure of the quenching and tempering heat treatment were analyzed using a metallographic microscope and SEM. TEM (Transmission Electron Microscope, Transmission Electron Microscope) is used to analyze the precipitates during the tempering process. The sample is a metal film produced by electrolytic double spraying after pre-grinding. The electrolytic double spraying liquid is 5% perchloric acid + 95% alcohol. The temperature is -20 C and the voltage is 75 V.
2.Test results and analysis and discussion
2.1 Properties of test steel and its impact fracture
Samples were taken from the quenched and tempered finished petroleum casings of the same batch and furnace number produced by the company for physical and chemical performance testing, and the dimensions of the two sets of impact specimens were inspected. The two sets of impact specimens had multiple specimens, starting from The dimensions and physical and chemical properties of the transverse impact specimens of Sample 1 and Sample 2 from the two groups of samples are shown in Table 2. The tensile properties are excellent. In the 0C impact test, the low-temperature impact performance of the sample fluctuated greatly. The average impact absorbed energy of sample 1 was 34.7J, while that of sample 2 was 127.3J, which was 3.7 times that of sample 1. The macro and micro morphology of the fracture surface of the impact specimen is shown in Figures 1 to 2. The area percentage of each area of the fracture surface is shown in Table 3. As can be seen from Figure 1, there are obvious vertical cracks in Sample 1 perpendicular to the direction of the incision. Only a small amount of fiber areas are found near the incision, and there is no obvious shear lip area. The average brittle section rate is 94.26% (Table 3) , is a typical brittle fracture (Figure 1a); the fracture surface of sample 2 has large fluctuations, plastic deformation has occurred on three sides except the incision, obvious shear lips have appeared at both ends, and the fiber area accounts for a large proportion. The average brittle fracture area ratio is 52.74%, which is only 56.0% of sample 1, showing ductile fracture (Fig.1b). As can be seen from Figure 2, the micromorphology of the fracture surface of Sample 1 is dominated by grain boundary fractures. There are cleavage facets in the grains that are fan-shaped and have a small amount of river patterns. There are no dimples, which is a complete brittle fracture (Figure 2a ); There are densely distributed small-sized equiaxed dimples on the fracture surface of Sample 2 (Figure 2b). They can effectively hinder the expansion of cracks and consume a lot of energy, so the impact toughness of Sample 2 is better.
|
Table 2 Dimensions and physical and chemical property inspection results of φ368mmx22.5mm high-strength petroleum casing impact specimens
|
|
Sample No
|
Impact specimen size
|
Physical and chemical properties
|
|
Width/mm
|
Thickness/mm
|
Length/mm
|
V-shaped notch angle/(°)
|
Notch root radius/mm
|
Notch depth/mm
|
Yield Strength/Mpa
|
Tensile strength/Mpa
|
Elongation/%
|
0℃Impact energy/J
|
|
1
|
2
|
3
|
average
|
|
1
|
10.02
|
10.02
|
55.35
|
normal
|
normal
|
1.995
|
844
|
930
|
24.5
|
32
|
37
|
35
|
34.7
|
|
2
|
10.05
|
10.05
|
54.13
|
normal
|
normal
|
2.020
|
829
|
914
|
25.0
|
25
|
127
|
125
|
127.3
|
|
Standard requirement
|
10±0.075
|
10±0.11
|
55±0.60
|
45±2
|
0.25±0.025
|
2±0.075
|
758~965
|
≥862
|
≥11.7
|
≥38
|
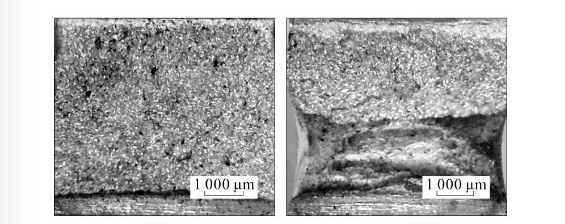
(a) Sample 1 (b) Sample 2
Figure 1 Macroscopic morphology of the fracture surface of the quenched and tempered oil casing impact specimen
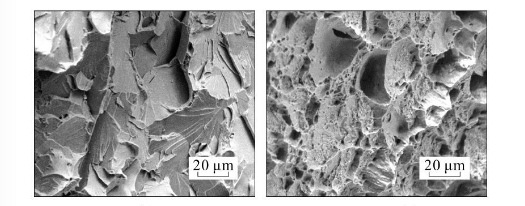
(a) Sample 1 (b) Sample 2
Figure 2 Microscopic morphology of the fracture surface of the quenched and tempered petroleum casing impact specimen
|
Table 3 The area percentage of each area of the fracture surface of the quenched and tempered petroleum casing impact specimen
|
|
Cut lip area
|
fiber area
|
radiation area
|
Average brittle fracture ratio
|
|
-
|
2.07/8.87/5.71
|
97.93/91.13/93.71
|
94.26
|
|
16.30/26.36/19.46
|
25.27/28.09/26.31
|
58.44/45.55/54.23
|
52.74
|
2.2 Structure of test steel and its inclusions
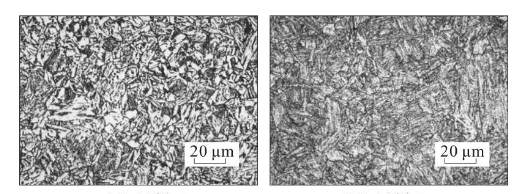
2.2.1 Austenite grain size during quenching and heating of the test steel. The austenite grain morphology of the impact sample is shown in Figure 3, which was measured using the cross-section method in Image-Pro Plus (IPP) image processing and analysis software. The grain size of the sample, the average size of the prior austenite grains in sample 1 is 10.82 μm, and the average size of the prior austenite grains in sample 2 is 11.93 μm, both show equiaxed grains , and the uniformity is good. The austenite particle size distribution of the impact sample is shown in Figure 4. The grain sizes of samples 1 and 2 are normally distributed, and the proportions of grains of different sizes are approximately the same.
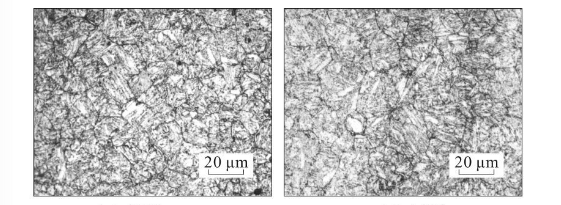
(a) Sample 1 (b) Sample 2
Figure 3 Austenite grain morphology of quenched and tempered petroleum casing impact specimens
2.2.2 Quenching and tempering heat treatment structure of test steel and its precipitates
The metallographic structure of the test steel after quenching and tempering heat treatment is shown in Figure 5.
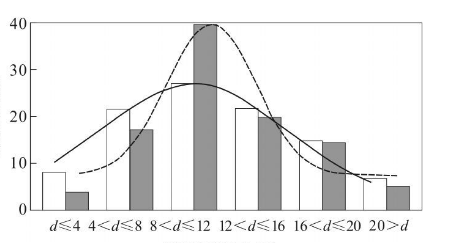
X: Austenite particle size distribution/μm
Y: Quantity ratio/%
White: Sample 1
Black: Sample 2
Figure 4 Austenite particle size distribution of quenched and tempered petroleum casing impact specimens
Samples 1 and 2 are both tempered troostite. The white area in the structure is the polygonal ferrite that recrystallized during tempering. The grain boundaries of sample 1 are sharp (Figure 5a); the original austenite of sample 2 is The body boundary is blurred and difficult to distinguish, and the tissue is more uniform (Figure 5b).
(a) Sample 1 (b) Sample 2
Figure 5 Metallographic structure of test steel after quenching and tempering heat treatment
Figure 6 shows the microstructure of the quenched and tempered heat-treated sample under a scanning electron microscope. The original lath-shaped quenched martensite decomposes, the martensite sheets are blurred, the interface features gradually disappear, and the martensite laths merge. Even blocks appear, and supersaturated carbon atoms precipitate as carbides at grain boundaries, between martensite laths, and also in martensite strips. The carbide size in the structure of sample 1 is larger, and there are more large-grain carbides along the grain boundaries. The carbides around the polygonal ferrite have gathered and grown, and the original austenite grain boundaries and martensite boundaries The surrounding carbides are connected into strips in the form of spheres and short rods, and the local length can reach about 1.5 μm (Fig. 6a). The structure in sample 2 is uniform. The boundaries of adjacent laths begin to decompose but still retain the martensite form. The laths are thinner and there are fine carbide precipitates in the laths. At the same time, there are also a large number of fine carbide precipitates distributed on the matrix. Carbide, carbide is uniformly dispersed in spherical or granular shape, with an average size of about 150 nm. The carbide at the grain boundary has not significantly coarsened, and the structure is evenly distributed, so the impact toughness of sample 2 is better (Figure 6b ).
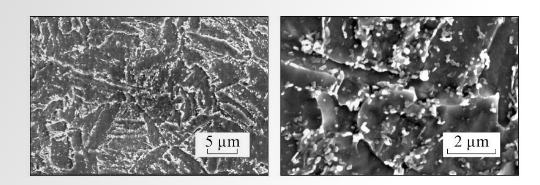
(a) Sample 1
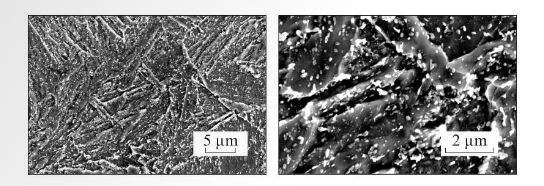
(b) Sample 2
Figure 6 Microstructure of the quenched and tempered heat treated sample under the scanning electron microscope
2.2.3 Inclusions in test steel
The inclusion grade evaluation results of the sample are shown in Table 4. The inclusions are grade 0.5~1, and the Class B inclusions in sample 1 are grade 0.5. All inclusions observed on the metallographic surface of Sample 1 and Sample 2, which were ground to about 30 μm, 60 μm and 90 μm layer by layer, were about 60. The number of inclusions in different layers of the sample is shown in Figure 7 shows that the size difference is small. Therefore, inclusions are not the main factor causing fluctuations in the impact toughness of this sample.
|
Table 4 Inclusion grade evaluation (grade) of quenched and tempered petroleum casing samples
|
|
Sample No
|
A
|
B
|
C
|
D
|
DS
|
|
1
|
0.5
|
0.5
|
-
|
1.5
|
0.5
|
|
2
|
-
|
-
|
-
|
1.5
|
0.5
|
|
Note: The statistics are based on the inclusion grades of fine series A, B, C and D.
|
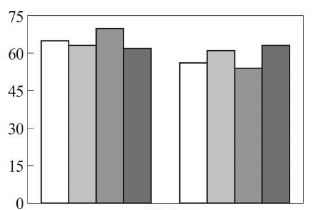
X: Sample number (1234 in sequence)
Y: Number of inclusions/piece
Figure 7 The number of inclusions in different layers of the quenched and tempered petroleum casing sample
2.3 Determination of factors affecting impact performance
The influencing factors of impact toughness can be roughly divided into chemical composition ratio, smelting quality (slag inclusions, inclusion types, size and distribution, component segregation, etc.), thermal processing (refining grains and structure is conducive to improving impact toughness), heat treatment Process, cold working (easy to produce work hardening and reduce impact toughness) and impact testing (test equipment, test temperature and sample processing, etc.). For the two groups of samples from the same batch studied, the reason for the large fluctuations in impact toughness is mainly due to the smelting quality. From the above analysis, it can be seen that the grain size of Sample 1 is slightly larger than that of Sample 2, and the structure is mainly tempered sorbite. The structure of Sample 2 is relatively uniform, and the grain size and structure are uneven due to factors such as unevenness. It will not cause the impact value of the two groups of samples to differ by more than 3 times. In sample 1, the carbides around the original austenite grain boundary and martensite boundary are connected in the form of spheres and short rods, and the local length can reach about 1.5 μm; in sample 2, the carbides are evenly distributed in the form of spheres or granules. Mainly, the average size is about 150 nm, so the analysis of carbide factors is focused. The transmission electron microscope photos and energy spectrum analysis results of carbides in the quenched and tempered heat treatment structure are shown in Figure 8. The energy spectrum analysis shows that the carbides mainly contain Fe, and also contain a small amount of Mn and Cr. The carbide energy spectrum analysis shows that it is cementite Fe3C. The carbides in sample 1 are mostly in the shape of short rods (Figure 8a~b), with a size of 60~300 nm, and are obviously coarsened. The grain boundary cementite is almost connected into micron-sized particles, and many carbide particles are distributed on the grain boundaries. , carbide particles aggregate in some areas to form a cementite film, which has a negative impact on impact performance. The carbides in sample 2 are uniformly distributed and in the form of spherical or granular shapes (Figure 8c~d), with an average size of 150nm and evenly dispersed distribution within the crystal, so the impact performance is good.
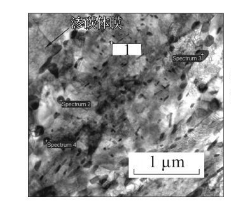
(a) Transmission electron microscope photo of sample 1
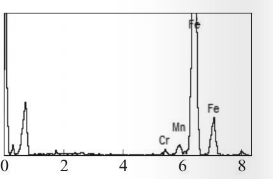
X: Energy KeV
Y: count
(b) Energy spectrum analysis results of sample 1
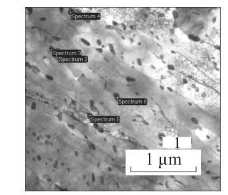
(c) Transmission electron microscope photo of sample 2
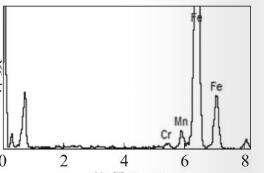
X: Energy KeV
Y: count
(d) Energy spectrum analysis results of sample 2
Figure 8 Transmission electron microscope photos and energy spectrum analysis results of carbides in the quenched and tempered heat-treated structure
The volume fraction of carbides in the sample was calculated through the image software. The volume fraction of carbides in sample 1 was 6.195%, and the volume fraction of carbides in sample 2 was 2.052%. The volume fraction of carbides was converted into the mass fraction of carbon in the steel using the method in the literature. After calculation, the carbon content in the high-carbon area in sample 1 was 0.413%, and the carbon content in the high-carbon area in sample 2 was 0.137%. According to the empirical formula (1), the transformation points A (austenitizing transformation end temperature) of sample 1 and sample 2 can be obtained to be approximately 857C and 902C respectively.
For hypoeutectoid steel, the quenching temperature is 30~50°C above Ac3. In actual production, 920°C is selected for quenching due to the addition of alloying elements. For the high carbon region in sample 1, the austenitization temperature is too high,
During heating, the carbides are almost completely dissolved, the austenite grains are coarse, the average grain size in this area is 14.4 μm, the martensite lath size is large and the performance is poor [2]; for the high carbon area in sample 2 , the austenitization temperature is appropriate, and the grain size is relatively small, 12.7 μm. According to the strong tempering resistance of low carbon steel, the tempering temperature of steel with low carbon content is correspondingly higher. At the same tempering temperature, the diffusion driving force of carbon in sample 1 is large and the migration speed is fast. The interface between martensite laths and the original austenite grain boundary provide fewer carbide nucleation points than sample 2, so the carbonization The materials aggregate and grow, forming a cementite film, resulting in uneven organization and poor impact performance [3]. The grains in Sample 2 are relatively fine. After high-temperature tempering, the structure uniformity is good, and the carbides are evenly distributed on the grain boundaries and matrix, resulting in good impact performance.
Observing the structure of multiple samples of steel pipes produced in the same batch, it was found that there are low carbon areas and high carbon areas. This is because carbon segregation exists in the steel casting billet. Therefore, the same steel pipe was sampled multiple times for impact performance testing, and the test results showed fluctuations. Carbon segregation leads to uneven microstructure, and quenching and tempering heat treatment alone cannot completely eliminate this uneven phenomenon. Therefore, for the high carbon zone, the main reason for low impact performance is that the tempering temperature after quenching is too high, causing carbides to accumulate and grow, and even cementite films are formed at the grain boundaries, resulting in coarse original austenite grains. The quenching heating temperature is also too high, and the austenite grain size is larger, which has a certain impact on the impact performance. Research has found that banded structures can occur in low carbon alloy steel, and the main reason for this is the banded segregation of C and Mn elements. Its elimination is mainly done by eliminating the banded segregation of C and Mn, mainly including some metallurgical processes. Means to speed up the cooling speed of the solidification process and reduce the degree of segregation of C and Mn elements; use higher soaking temperature and soaking time to speed up the diffusion of C and Mn elements; thermal processing during the rolling process, high temperature and large deformation calorimetry Rolling makes the spacing between dendrites smaller, which is beneficial to the homogenization of elements. Therefore, designing an appropriate electromagnetic stirring process during the metallurgical process to improve the metallurgical quality can effectively reduce the fluctuations in the impact performance of steel pipes.
3.Conclusion
(1) The important parameter that affects the low-temperature impact toughness fluctuation of quenched and tempered oil well pipes is the segregation of carbon during the smelting process, which makes the original austenite grains of Sample 1 coarse. After tempering, the carbides aggregate and grow, and even in the crystal The boundary is film-formed, so the impact toughness is poor;
(2) In order to improve the stability of the low-temperature impact toughness of quenched and tempered oil well pipes, it is necessary to reduce carbon segregation through a suitable electromagnetic stirring process during the smelting process.
Read more: The causes of OCTG casing stuck or Research on sealing performance of OCTG casing connection


 Eastern Steel Manufacturing Co.,Ltd not only improve product production and sales services, but also provide additional value-added services. As long as you need, we can complete your specific needs together.